On this page
- Why most restaurant reporting fails
- Prime cost: the restaurant KPI that decides your survival
- Revenue KPIs: average check, table turnover and RevPASH
- Guest KPIs: the leading indicators
- Break-even point: the number that sets your daily target
- The daily, weekly, monthly restaurant reporting routine
- Frequently Asked Questions
- See every number in this guide on one screen
Most restaurant dashboards are noise. Forty tiles, a dozen charts, and you still find out on the 10th of the month that last month lost money. The restaurant KPIs that actually matter are a short list: a handful of numbers that tell you every single day whether you're making money and exactly where it's leaking.
This guide walks through those numbers: what each one means, how to calculate it, what a healthy range looks like, and a daily, weekly, monthly rhythm that keeps you ahead of problems instead of reading about them in the P&L five weeks later. No finance degree needed. If you can read a till report, you can run this system.
Why most restaurant reporting fails
Restaurant reporting usually fails in one of three ways. Some operators track everything, so nothing stands out; when 40 metrics are “key”, none of them are. Others run on gut feel, which works right up until a slow supplier price creep or a quiet-Tuesday overstaffing pattern eats the margin. The third group reviews numbers only when the accountant sends the monthly P&L, which hands every problem a five-week head start.
The fix isn't more data. It's a few numbers, checked on a schedule, pulled automatically from systems you already run. If getting yesterday's sales, labor and voids into one view takes a spreadsheet export, fix that first: a proper restaurant analytics dashboard assembles those numbers while you sleep.
Prime cost: the restaurant KPI that decides your survival
Prime cost is your cost of goods sold (food and beverage) plus your total labor cost, including payroll taxes and benefits, expressed as a percentage of sales. It matters more than any other number because it combines the only two large costs you can actually influence week to week. Rent is fixed. Utilities barely move. Prime cost is where a restaurant is won or lost.
How to calculate prime cost
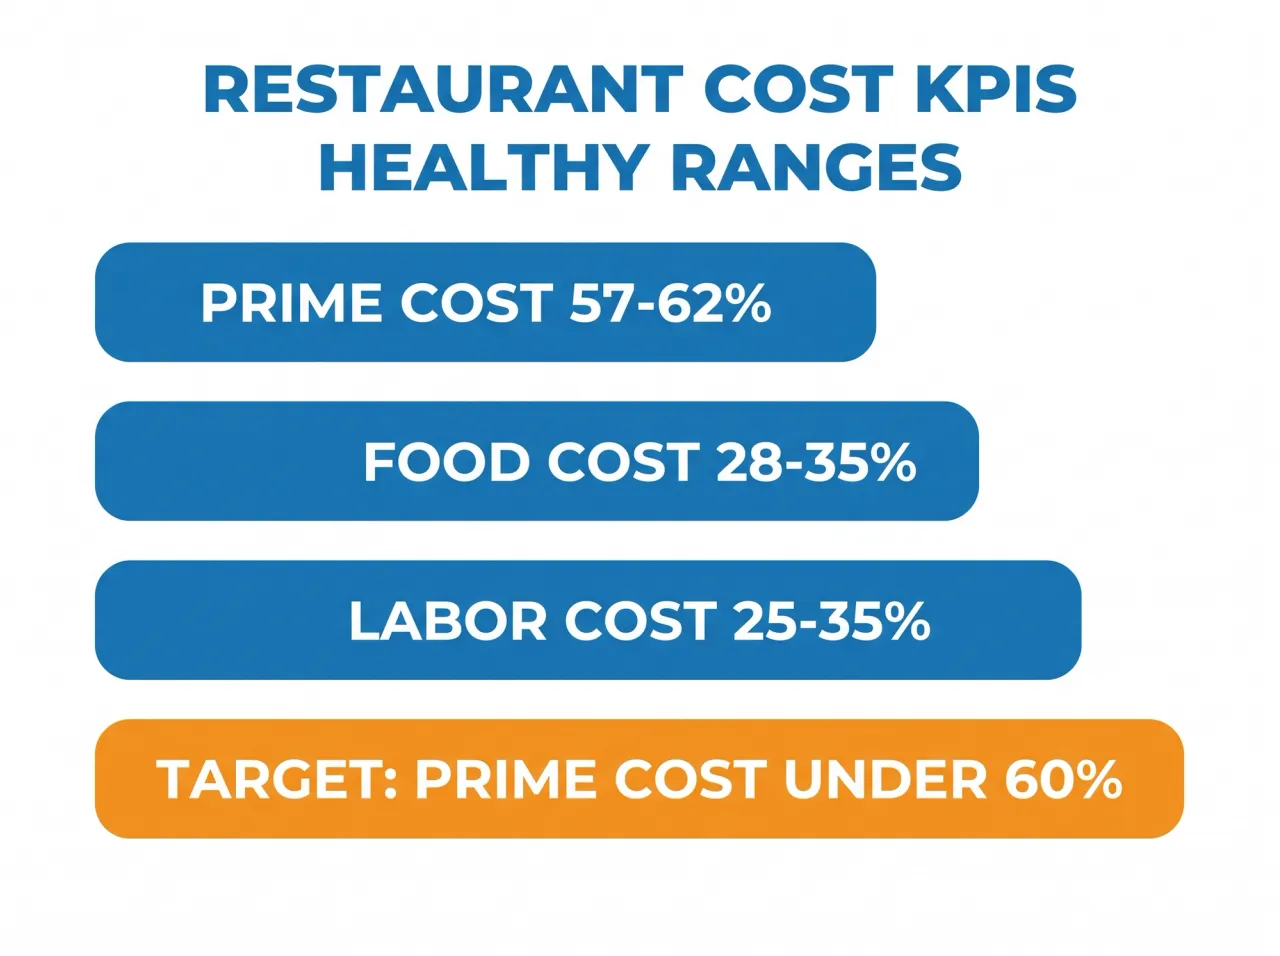
Take one month: 100,000 in sales, 30,000 in cost of goods, 32,000 in labor. Prime cost is 62,000, or 62%. Full-service restaurants typically land between 57% and 62%; quick service can run 55% or below because the labor model is leaner. Above 65% for more than a month or two, and there's usually no room left for rent, marketing and profit, no matter how busy the room looks.
Track it weekly, not monthly. A weekly prime cost number turns a slow leak into a same-week fix, and the stakes are easy to state: one point of prime cost on 100,000 of monthly sales is 1,000 of profit.
Food cost percentage
Food cost percentage is cost of goods divided by food sales, and most full-service operations sit between 28% and 35%. The number to watch isn't the percentage itself, though: it's the gap between your theoretical food cost (what the menu math says you should spend) and your actual purchases. That variance is waste, over-portioning, unrecorded comps, or theft. Our food cost percentage guide covers the calculation and the fixes in detail.
Counting this by hand is exactly the kind of work that gets skipped in a busy week, which is why operators who take it seriously use food cost management software to log purchases, cost recipes and flag variance automatically.
Labor cost and sales per labor hour
Labor cost percentage (total labor divided by sales) should land between 25% and 35% depending on your format. The more actionable number is sales per labor hour: total sales divided by scheduled labor hours. Labor percentage tells you there's a problem; sales per labor hour tells you which shift it's on.
Say Friday dinner does 110 in sales per labor hour and Tuesday dinner does 45 with the same floor team. Tuesday is overstaffed, and now you know by how much. Adjusting templates shift by shift is how you reduce restaurant labor costs without touching service quality on the nights that pay the bills.
Revenue KPIs: average check, table turnover and RevPASH
Average check is sales divided by covers, and it's the cheapest revenue lever you have: the guests are already seated. Move it with menu engineering, with servers trained on one specific recommendation per course, and with add-ons at the point of order. A 6% lift in average check flows almost straight to profit if prime cost holds.
Table turnover is how many parties a table serves per service; most full-service rooms land between 1.5 and 2 at dinner. RevPASH, revenue per available seat hour, is the honest version of both: total revenue divided by seats times open hours. It exposes the dead zones your daily total hides, like the 3 to 6 pm shoulder where the room sits at 15% of capacity.
Three moves that reliably lift these numbers:
- Tighten the seating map so twos don't occupy fours: a floor plan tuned to your actual party mix adds turns without rushing anyone.
- Sell the shoulder: a limited 3 to 6 pm menu, a coffee-and-dessert positioning, or a happy hour raises RevPASH on hours you're already paying for.
- Prune the menu: fewer, better items speed up the kitchen, raise perceived quality and shorten ticket times, which feeds straight back into turnover.
Guest KPIs: the leading indicators
Sales data tells you what already happened; guest numbers tell you what's about to. The big one is repeat rate: what share of this month's guests have visited before. Winning a new guest is expensive, and most of the proven ways to increase restaurant revenue start with earning a second visit, because regulars order with confidence and spend more per visit.
Watch your void and comp rate daily: a sudden climb means kitchen mistakes, a menu item failing, or a discipline problem at the till. And track your review trend, not your review average. A 4.6 falling toward 4.3 is an alarm; a 4.1 climbing toward 4.4 means the fixes are working. Direction beats level.
Break-even point: the number that sets your daily target
Break-even is the sales level where you stop losing money, and it turns every other KPI into context. The quick method: split your costs into variable (food, beverage, hourly labor; roughly your prime cost) and fixed (rent, salaried staff, utilities, insurance, subscriptions). Divide monthly fixed costs by your contribution margin, which is 1 minus your variable cost percentage. It isn't accountant-perfect, but it's close enough to run a restaurant by.
Say fixed costs are 40,000 a month and prime cost runs 62%, so 38 cents of every unit of sales is left to cover them. Break-even is 40,000 divided by 0.38, about 105,000 a month, or roughly 3,500 a day. That daily figure is the point of the exercise: a 3,100 Tuesday stops being a vague worry and becomes a known 400 gap you can attack with a targeted promotion, a tighter schedule, or a better average check.
The daily, weekly, monthly restaurant reporting routine
Cadence beats depth. Five disciplined minutes every morning will do more for your margins than a heroic quarterly analysis. Here's a rhythm that fits a working operator's day:
- Daily, 5 minutes: yesterday's sales against the same day last week, labor percentage, voids and comps, covers or order count. Four numbers, one coffee.
- Weekly, 30 minutes: prime cost, food cost variance against theoretical, sales per labor hour by shift, and your top and bottom ten menu items.
- Monthly, one hour: the full P&L, RevPASH trend, repeat rate, and one decision about which single number gets focused attention next month.
The routine only sticks if the numbers are waiting for you, not the other way around. This is exactly what Quickbuy's live dashboard was built for: sales, labor, voids and item performance in one view, updated as orders happen, so the morning check takes five minutes instead of forty.
Frequently Asked Questions
What KPIs should a restaurant track daily?
Four numbers: sales versus the same day last week, labor cost percentage, voids and comps, and covers or order count. Together they catch most operational problems within 24 hours. Save prime cost, food cost variance and menu analysis for the weekly review, where they belong.
What is prime cost in a restaurant?
Prime cost is cost of goods sold plus total labor cost, expressed as a percentage of sales. If you sell 100,000 and spend 30,000 on food and drink and 32,000 on labor, your prime cost is 62%. It's the single best health check because it combines the two biggest costs you can actually control.
What is a good prime cost for a restaurant?
Under 60% of sales is the classic benchmark. Full-service restaurants usually land between 57% and 62%, while quick-service formats can run at 55% or below. A prime cost that stays above 65% for months signals a pricing, portioning or scheduling problem that needs a direct fix.
How often should I review restaurant KPIs?
Daily for the fast movers (sales, labor, voids), weekly for prime cost and food cost variance, monthly for the full P&L, RevPASH and repeat rate. Frequency matters more than depth: a five-minute daily check catches in a day what a monthly review catches in five weeks.
See every number in this guide on one screen
Quickbuy pulls your POS sales, online orders, labor and food costs into one live dashboard, so the KPIs in this guide track themselves. You set the targets; it shows you, every morning, exactly where yesterday landed.
Plans start lean enough for a single-location cafe and scale to multi-branch groups. See Quickbuy's pricing and start tracking the numbers that actually matter.