On this page
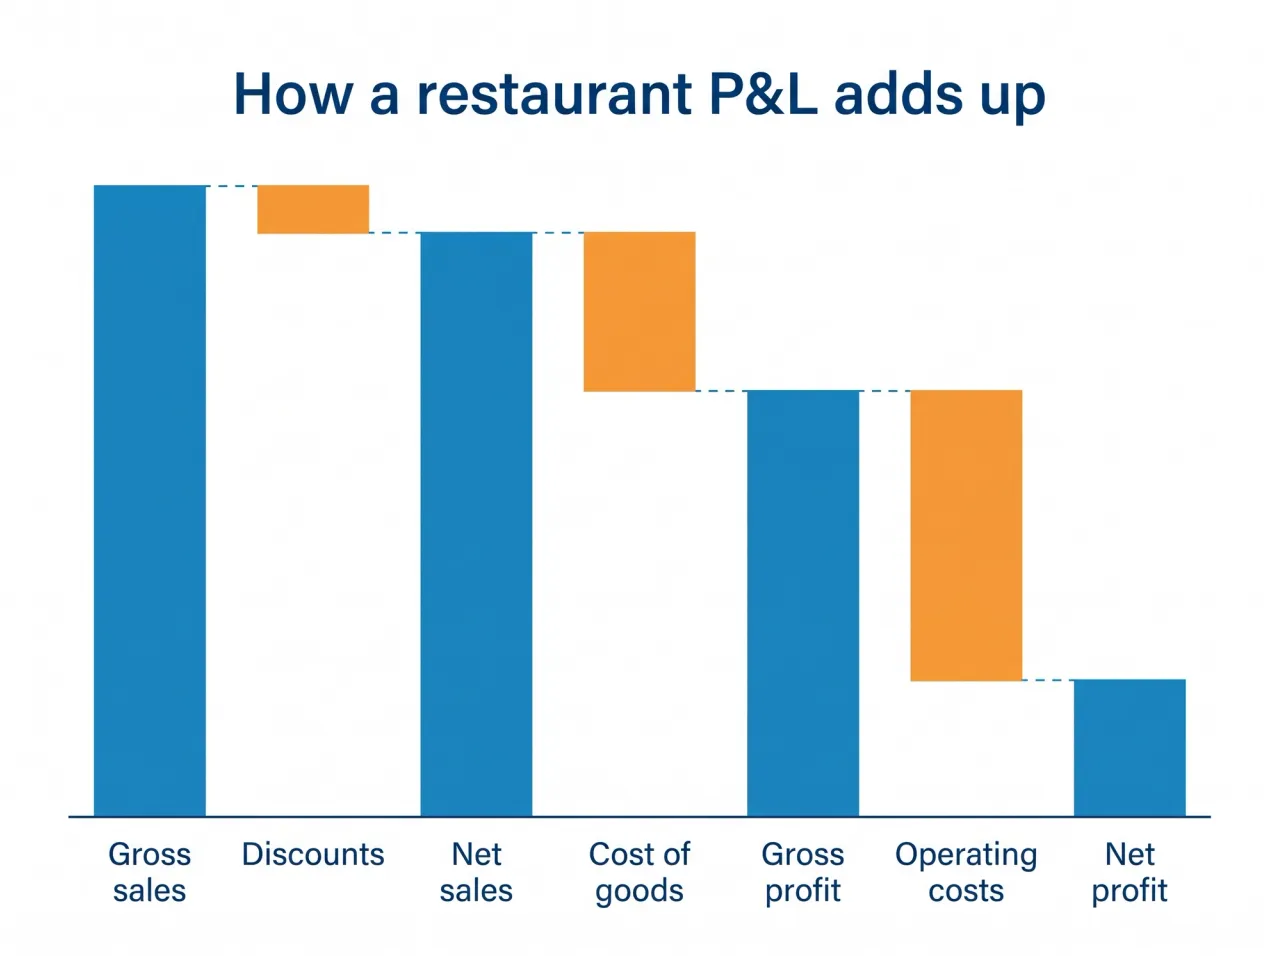
A restaurant profit and loss statement (P&L) shows what you sold over a period, what it cost to make and serve it, and what was left as profit. You read it from the top down: net sales, minus the cost of food and drink, gives gross profit; minus labour and every other operating cost, it gives net profit.
Most owners look at the bottom line and stop. The lines in between are more useful, because each one points at a decision you can change: prices, portions, rota, rent or suppliers. This guide walks through every line of a restaurant P&L, shows a worked example and gives you a simple template you can copy.
What is a restaurant profit and loss statement?
It's a report of income and costs over a set period, usually a month. It's also called an income statement. Unlike your bank balance, it matches each month's sales with that month's costs, so a supplier bill you'll pay next month still counts against the food you sold this month.
If you run more than one site, produce one P&L per branch as well as a combined one. A combined P&L can hide a branch that loses money behind one that makes it.
What goes on a restaurant P&L?
Every restaurant P&L follows the same order. Here's what each line means and what to look for.
Sales
Gross sales is everything you charged guests. Take off discounts, voids and comps to get net sales, the figure every percentage below is measured against. In the UAE, report sales without VAT: the 5% you collect is owed to the tax authority, so it isn't revenue. If you sell through delivery apps, record those sales at the full menu price and put the app's commission under operating expenses, so you can see what delivery really costs.
Cost of goods sold
Cost of goods sold (COGS) is the food, drink and packaging that went into what you sold. Divided by net sales, it gives your food cost percentage. Our guide to food cost percentage shows how to calculate it and where it leaks.
Gross profit
Net sales minus cost of goods. It tells you how much each dirham of sales leaves to pay for everything else. A falling gross margin with steady sales usually means rising supplier prices, bigger portions or more waste.
Labour
Salaries, wages, overtime, staff accommodation and visas, benefits and staff meals. It's usually the largest cost after food. Add it to cost of goods and you get prime cost, the number many operators watch weekly.
Operating expenses
Everything else it takes to open the doors: rent, utilities, maintenance, marketing, licences, insurance, card processing fees, delivery app commission and software. Group them the same way every month, or you can't compare one month with the next. Note one-off costs, such as a large repair, separately, so a single bill doesn't hide the trend.
Net profit
What's left after every cost. Divided by net sales, it's your net profit margin. Corporate tax, interest and depreciation are often shown below this line, so check which version of net profit you're comparing. And net profit isn't cash in the bank: loan repayments, equipment purchases and the VAT you pay over don't hit the P&L the same way, so watch your cash separately.
A worked example
Here's one month at a casual restaurant, with round numbers to show how the lines connect. It's an illustration, not a benchmark:
- Gross sales: AED 104,000, minus discounts of AED 4,000, gives net sales of AED 100,000
- Cost of goods: AED 31,000 (31%), so gross profit is AED 69,000 (69%)
- Labour: AED 33,000 (33%), which makes prime cost AED 64,000 (64%)
- Rent AED 9,000, utilities AED 4,000 and other operating costs AED 17,000
- Net profit: AED 6,000, a 6% net margin
Read it as questions. Is cost of goods up on last month while prices stayed the same? Did labour rise faster than sales? Our guide to restaurant KPIs covers prime cost and the other numbers worth tracking alongside the P&L.
What is a good net profit margin for a restaurant?
Lower than most people expect. In the United States, the National Restaurant Association's 2025 operations report found median pre-tax income of 2.8% of sales for full-service restaurants and 4.0% for limited-service restaurants in 2024. UAE costs are different, especially rent and staff housing, so use those figures as context rather than a target.
Your own trend matters more than any benchmark. A margin that's slowly rising, month on month, is a better sign than one good month.
Most owners only see the P&L when the accountant sends it, weeks after the month closed. By then the waste has already happened. If you can see this month's numbers while it's still this month, you can still do something about them.
How often should a restaurant do a P&L?
Monthly, and within a week or two of the month ending, while you can still act on it. Compare each month with the one before and with the same month last year, because restaurant sales are seasonal: Ramadan, summer and the cooler months all change the picture.
Keep the same dates and the same categories every time. A year of consistent monthly P&Ls is also what your accountant needs at year end. In the UAE, Corporate Tax starts from your accounting profit, which our guide to restaurant bookkeeping in the UAE explains.
A simple restaurant P&L template
Copy these lines into a spreadsheet, one column per month, with each line also shown as a percentage of net sales:
- Gross sales, discounts and net sales
- Cost of goods: food, drink and packaging
- Gross profit and gross margin
- Labour: salaries, wages, overtime and staff costs
- Operating expenses: rent, utilities, marketing, maintenance, fees and other costs
- Net profit and net margin
How Quickbuy builds your P&L
Quickbuy builds the P&L for any date range, branch by branch, from your orders, your supplier bills and the expenses you record by category. Cost of goods comes from your recipes, so it follows what you actually sold. The report shows gross sales, discounts, net revenue, cost of goods, gross profit and margin, operating expenses by category, and net income and margin, next to your food cost percentage and average order value. It sits with the rest of your restaurant accounting, and your sales analytics show which dishes earn the most.
Frequently Asked Questions
What goes on a restaurant P&L?
Sales and discounts, net sales, cost of goods sold, gross profit, labour, operating expenses such as rent, utilities and marketing, and net profit. Each line is usually shown in money and as a percentage of net sales.
What is a good net profit margin for a restaurant?
Margins are thin everywhere. US data from the National Restaurant Association put median pre-tax income at 2.8% of sales for full-service and 4.0% for limited-service restaurants in 2024. Track your own margin month by month rather than chasing a single benchmark.
How often should a restaurant do a P&L?
At least monthly, within a week or two of month end. Many operators also check prime cost weekly, because food and labour move faster than the rest of the P&L.
What is the difference between gross and net profit?
Gross profit is net sales minus the cost of food and drink. Net profit is what's left after labour, rent and every other operating cost as well. Gross profit shows how well you price and buy; net profit shows whether the whole business makes money.
Read it every month
A restaurant P&L is only useful if you read it while you can still act. Use the same lines every month, compare against last month and last year, and follow any line that moves to the decision behind it. When you want the P&L ready without waiting for month end, see Quickbuy's plans and pricing.